A Landscape of Limit Sets Deformations
Description and context
The visualisation on this page gives an idea of how Limit sets deform by changing a representation inside the character variety of the 8-knot complement with target group PU(2,1). Here, each point correspond to a (computed) representation of the fundamental group of the 8-knot complement in SU(2,1), as parametrized in Guilloux-Will. It is a group generated by two elements, a and b, of order 3, with the additional property that the product ab has order 4. The parameter u below defines the four parameter of Guilloux-Will. Namely, it sets: z1=z3=1, z2 = u and z4 is the conjugate of z2.
Some information and context from the literature:
- The blue curve corresponds to the locus where the image of a-1b is ellipto-parabolic. On its left, this element becomes elliptic and we have not tried to picture the limit set. On its right, this element is loxodromic. The cusp of the blue curve corresponds to a unipotent representation, which is the holonomy representation of a uniformized CR-spherical spherical CR structure on the 8-knot complement, as described by Deraux-Falbel. Its limit set is pictured on load below the representation of the character variety.
- By a result of Acosta, locally around this point, the pictured representations are holonomy representation of a spherical CR-structure on a non-hyperbolic Dehn surgery on the 8-knot complement. But this representation is not proven to be uniformizable.
- By results of Parker, Wang, along the line of parameters u real, the representation are discrete and uniformize this same Dehn surgery. In fact, these representations correspond to (3,3,4)-complex hyperbolic triangular groups.
- By results of Pozzetti-Sambarino-Wienhard, the same holds in a neighborhood of this line.
R. Alexandre has used similar computations for his paper on redundancy of hyperbolic triangle groups.
The visualization
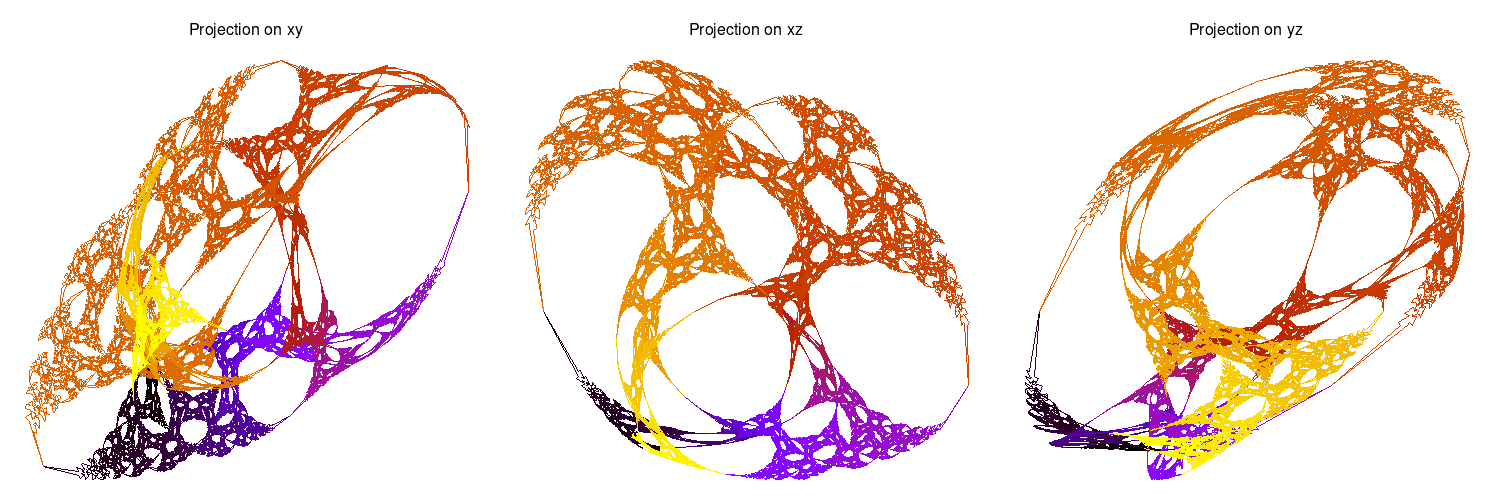
- By hovering above a green point, you get below 3 snapshots of the limit set of the associated representation. Indeed, these limit sets lie in a 3-dimensional sphere (the boundary at infinity of the complex hyperbolic plane). They are projected to the space R3 by a stereographic projection. The 3 snapshots are then taken along each axis.
- By clicking on such a point, you will open the access to a 3d visualization.
u = 3

Contributors, sources and to-do
The source code for the computation has been developed by Raphael Alexandre and Antonin Guilloux; the code for this visualization by Antonin Guilloux and Thi Thu Quyen Nguyen, with the help of V. Cornet and J. Tierny.
The code for the computations and visualization can be found in two git depots: CR-limit-sets, and HypSurfCR. Feel free to ask for access if you want to replicate/contribute.
There is still a lot of work to do to build what we would like for this landscape. This includes - but is not limited to - the following:
- Compute approximations of useful invariants (Hausdorf measure...)
- Other landscapes for other families of representations...
- Better document, optimize and share the code.